
Effect for PowerBI
Data visualization is a powerful tool for understanding complex data and making informed decisions. By transforming large amounts of information into a graphical form, data visualization helps individuals and organizations better understand trends, patterns, and relationships in their data.
There are many different data visualization tools, each with its own strengths and weaknesses. The most commonly used tool is Microsoft's Power BI.
Power BI: Power BI is a data visualization tool developed by Microsoft. It offers a wide range of features, including advanced analytics, machine learning and data modeling. Power BI also offers collaboration and insight sharing features that make it easy to share data and insights with others. It is well suited for organizations that want a comprehensive view of their business data.
Power BI is a powerful data visualization and business intelligence tool developed by Microsoft. It helps businesses turn their data into actionable insights and make data-driven decisions. With its intuitive user interface and wide range of features, Power BI is quickly becoming one of the most popular data visualization tools on the market.
One of the most important features of Power BI is its ability to connect to a variety of data sources, including Excel spreadsheets, cloud-based databases, and local data sources. This makes it easy to combine and analyze data from different sources to get a comprehensive view of your business.
Visualizations are another important feature of Power BI. Power BI offers a wide range of visualizations, including bar charts, line charts, scatter plots, pie charts and heat maps. These visualizations can be customized to meet your specific needs, making it easy to create interactive and engaging reports that help you communicate complex data clearly.
Power BI also offers a number of advanced analytics features, including predictive analytics, machine learning, and data modeling. These features allow you to dig deeper into your data and gain new insights that help you make better decisions.
In addition to advanced analytics, Power BI also offers collaboration and sharing features that make it easy for you to share your data and insights with others. You can publish your reports on the web, share them with others in your organization, or embed them in other applications.
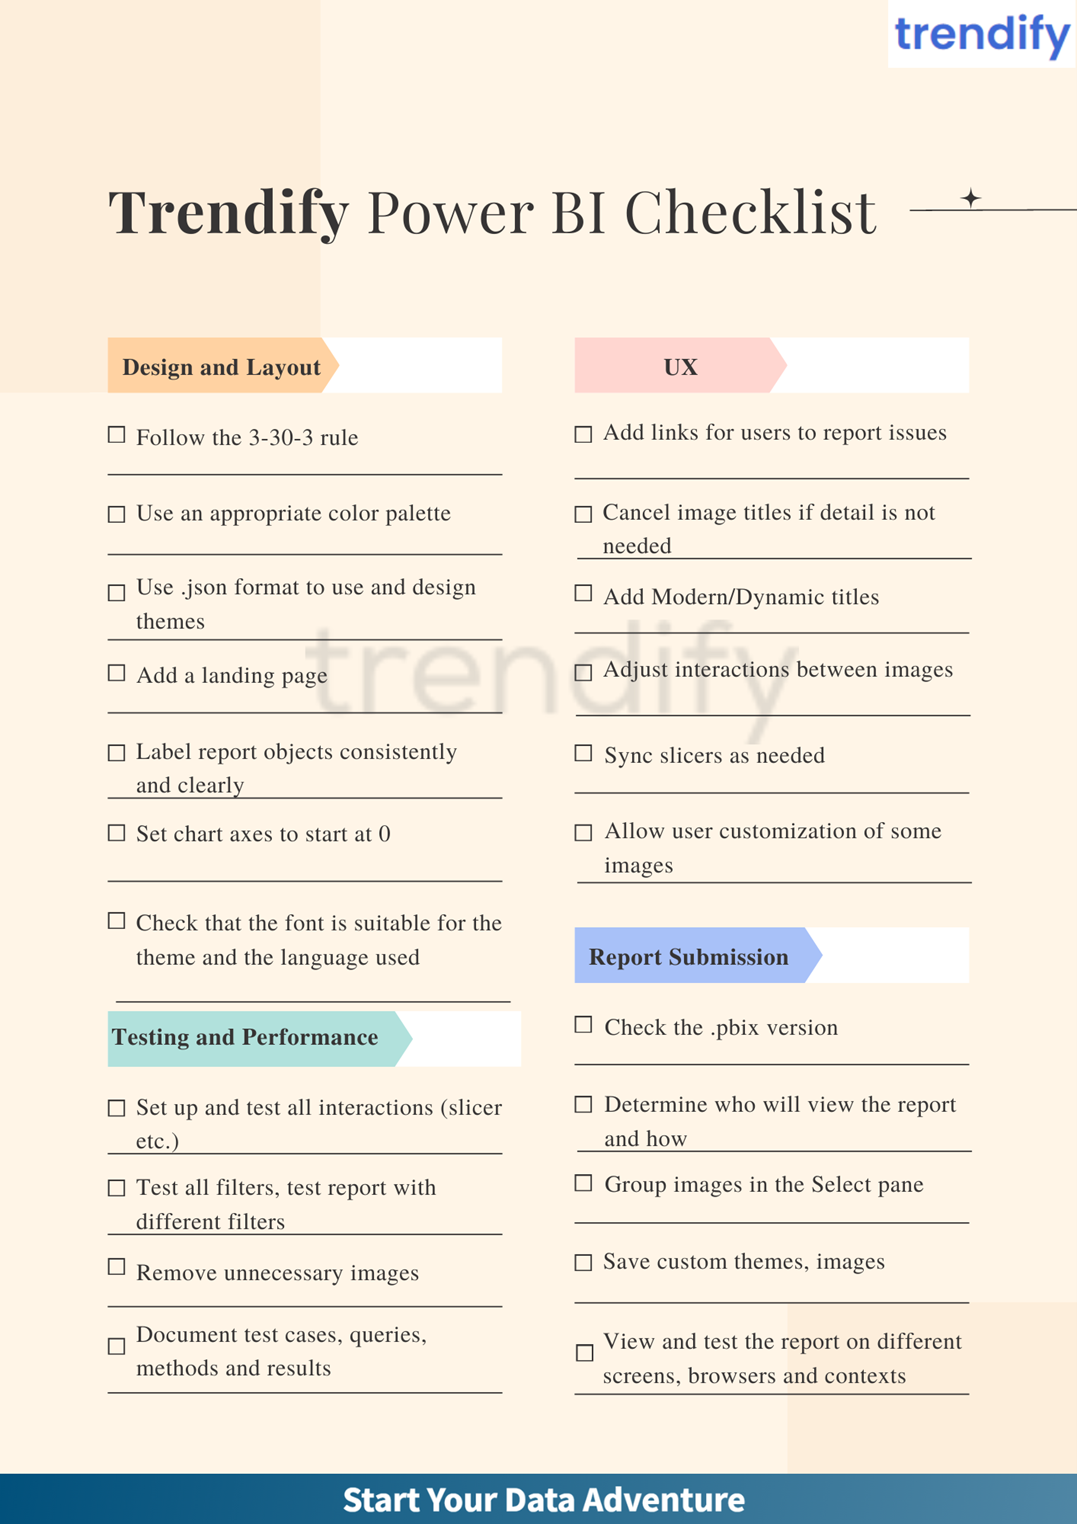
As Trendify, we use the Power BI application in our consulting services. We provide a comprehensive service to our clients with the checklist below that we use when creating their reports.
You can also use this checklist in your PowerBI reports.
Studies have shown that visualizing data can help us process information faster and more accurately. When we see data in a visual format, such as a graph or chart, our brains are able to process and understand the information much faster than if we were to read the same information in a table or list format. This is because our brains are wired to process visual information more efficiently.
But the benefits of data visualization go beyond processing information faster. Studies have also shown that visualizing data can also help us make better decisions. When we see data in a visual format, we can see patterns and relationships that may not be immediately apparent in a table or list format. This can lead to new insights and ideas that help us make better decisions
Another surprising aspect of data visualization is its impact on our emotions. Data visualization can be used to tell stories and evoke emotions such as joy, sadness, and frustration. By visualizing data in an engaging and compelling way, we can create an emotional connection with our audience that can help us convey complex information clearly and concisely.
In summary, data visualization is a powerful tool for turning complex data into meaningful insights, but it also has a surprising impact on the way we think and make decisions. If you would like to use our consulting services and product, you can contact us.